Introduction to Business Analysis Report
Copy link & title
Update Time: 18 Sep 2026 03:19
The Business Analysis report is designed for operations and management teams, providing a holistic view of business performance from an operator's perspective. It covers key dimensions including sales performance, revenue and profit, cancellations, refunds, advertising spend, and product inventory — enabling users to move from data viewing to informed business decision-making.
With this report, you can:
- Integrated Analysis — Combine Time Trend, Period Statistics, and Store Monitor in one interface for faster analysis.
- Real-Time Profit Estimation — Track estimated gross profit and margin based on order data before settlement.
- Multi-Platform Insights — Analyze and compare data across Shopee, TikTok, and Lazada in one place.
- SKU-Level Analysis — View product performance from store, Store SKU, and Merchant SKU levels.
- Easy Export — You can download data details for internal or futher analysis, quick and easy.
🔈If you need to compare the data in BigSeller with the Seller Center, please use the following time fields for comparison:
→ Shopee: BigSeller recommends using Order Time for statistics.
→ TikTok Shop: BigSeller recommends using Confirmation Time for statistics.
→ Lazada: BigSeller recommends using Payment Time for statistics.
→ Shopee: BigSeller recommends using Order Time for statistics.
→ TikTok Shop: BigSeller recommends using Confirmation Time for statistics.
→ Lazada: BigSeller recommends using Payment Time for statistics.
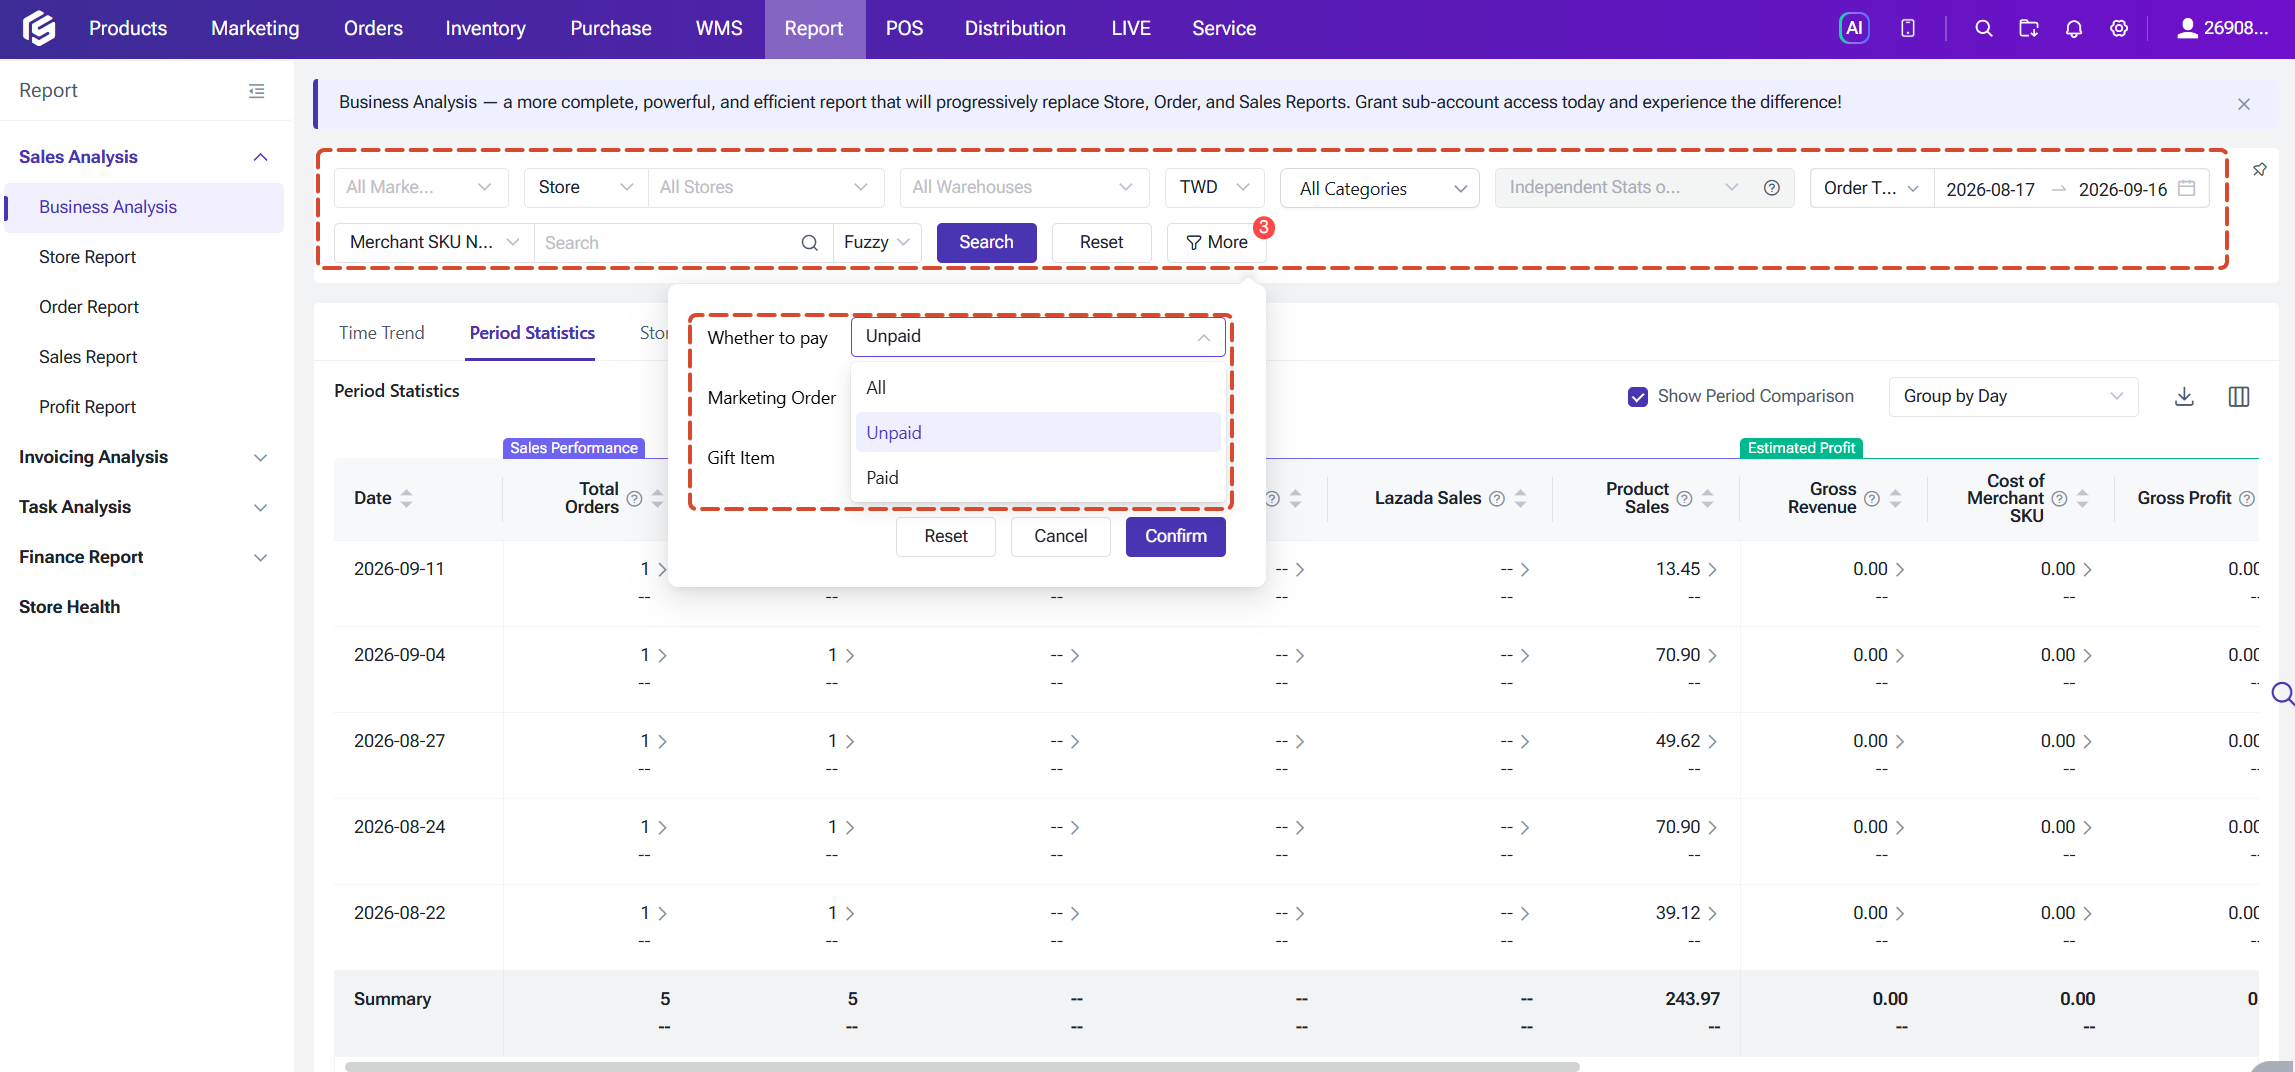
The Business Analysis page consists of two main areas: a Global Filter Bar at the top and three analysis modules below. The Global Filter Bar is shared across all three modules. When you switch between module tabs, your filter selections are retained.
- You can filter by platform (Shopee, Lazada, TikTok, and POS retail stores), by individual store or store group, and by date range. The date range supports two statistical time types: Order Date (based on when the order was placed) and Payment Date (based on when payment was confirmed). You can switch between the two depending on your analysis needs.
- You can also choose to view data in selected currency, and control how TikTok Sample Orders and Marketing Orders are counted — choosing to include them, exclude them, or view them in isolation.
- Supports tracking unpaid orders with a Payment Status filter, allowing sellers to filter orders by payment status and gain deeper insights into their business data.
1. Time Trend
The Time Trend module covers five business categories — Sales Performance, Revenue Estimation, Cancelled Orders, Refunded Orders, and Product Subsidies. By default, commonly used metrics are displayed, but you can fully customize which metrics appear and pin the ones most relevant to you. Additional metrics have been added in recent update, including more SKU-level and refund-related fields.
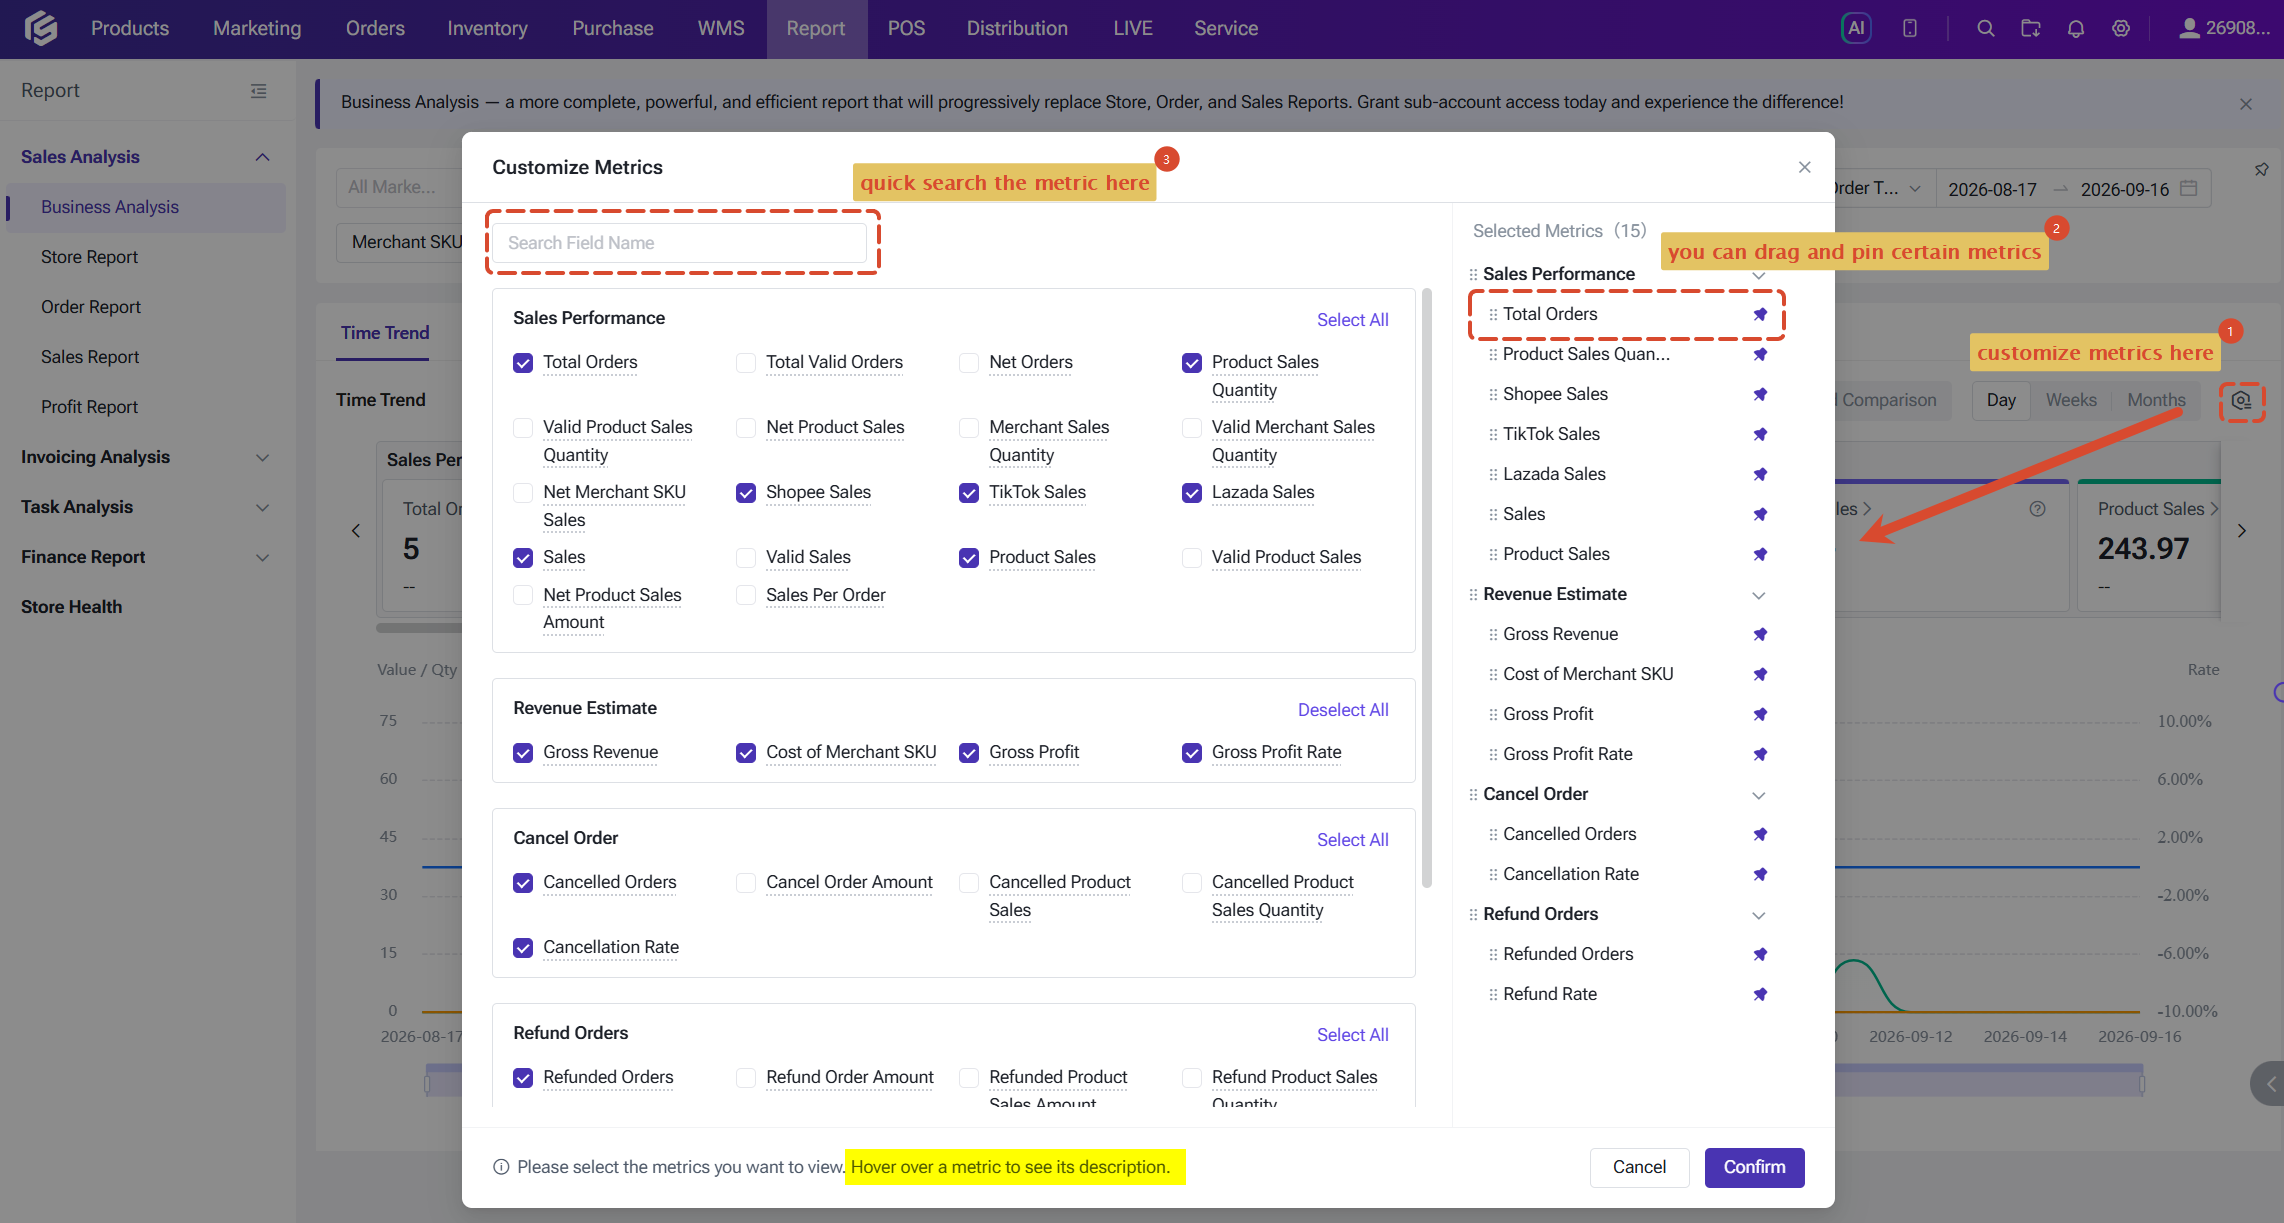
The module supports two comparison modes:
The module supports two comparison modes:
- In Metric Comparison mode, you can click on any metric name to add it to the line chart, with up to five metrics displayed simultaneously for side-by-side comparison.
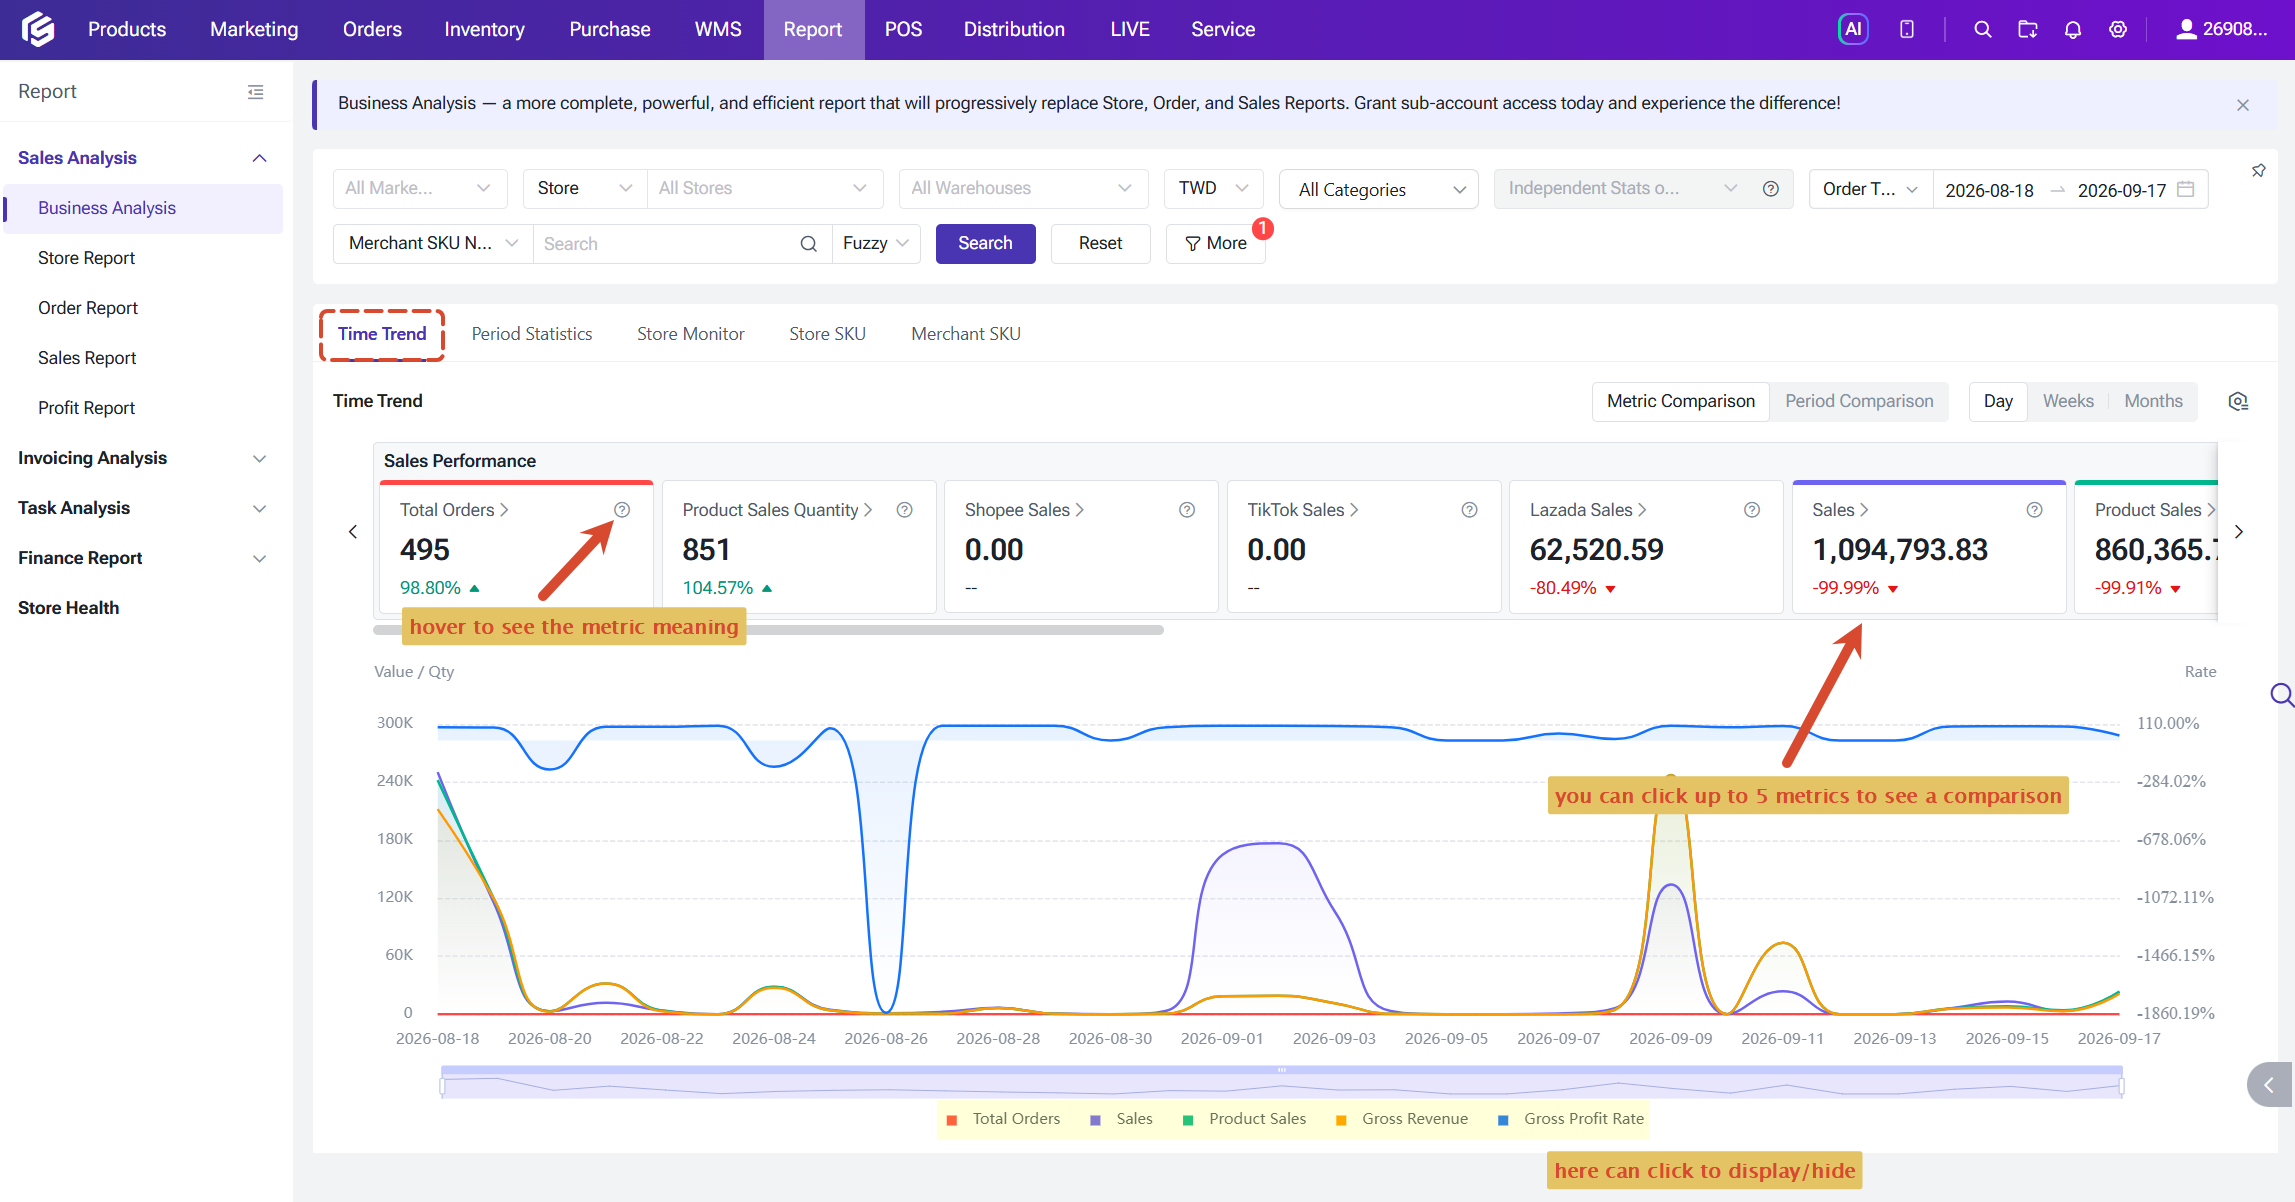
- In Period Comparison mode, you can track a single metric across daily, weekly, or monthly intervals — viewing day-over-day, week-over-week, or month-over-month changes to understand longitudinal trends over time.
2. Period Statistics
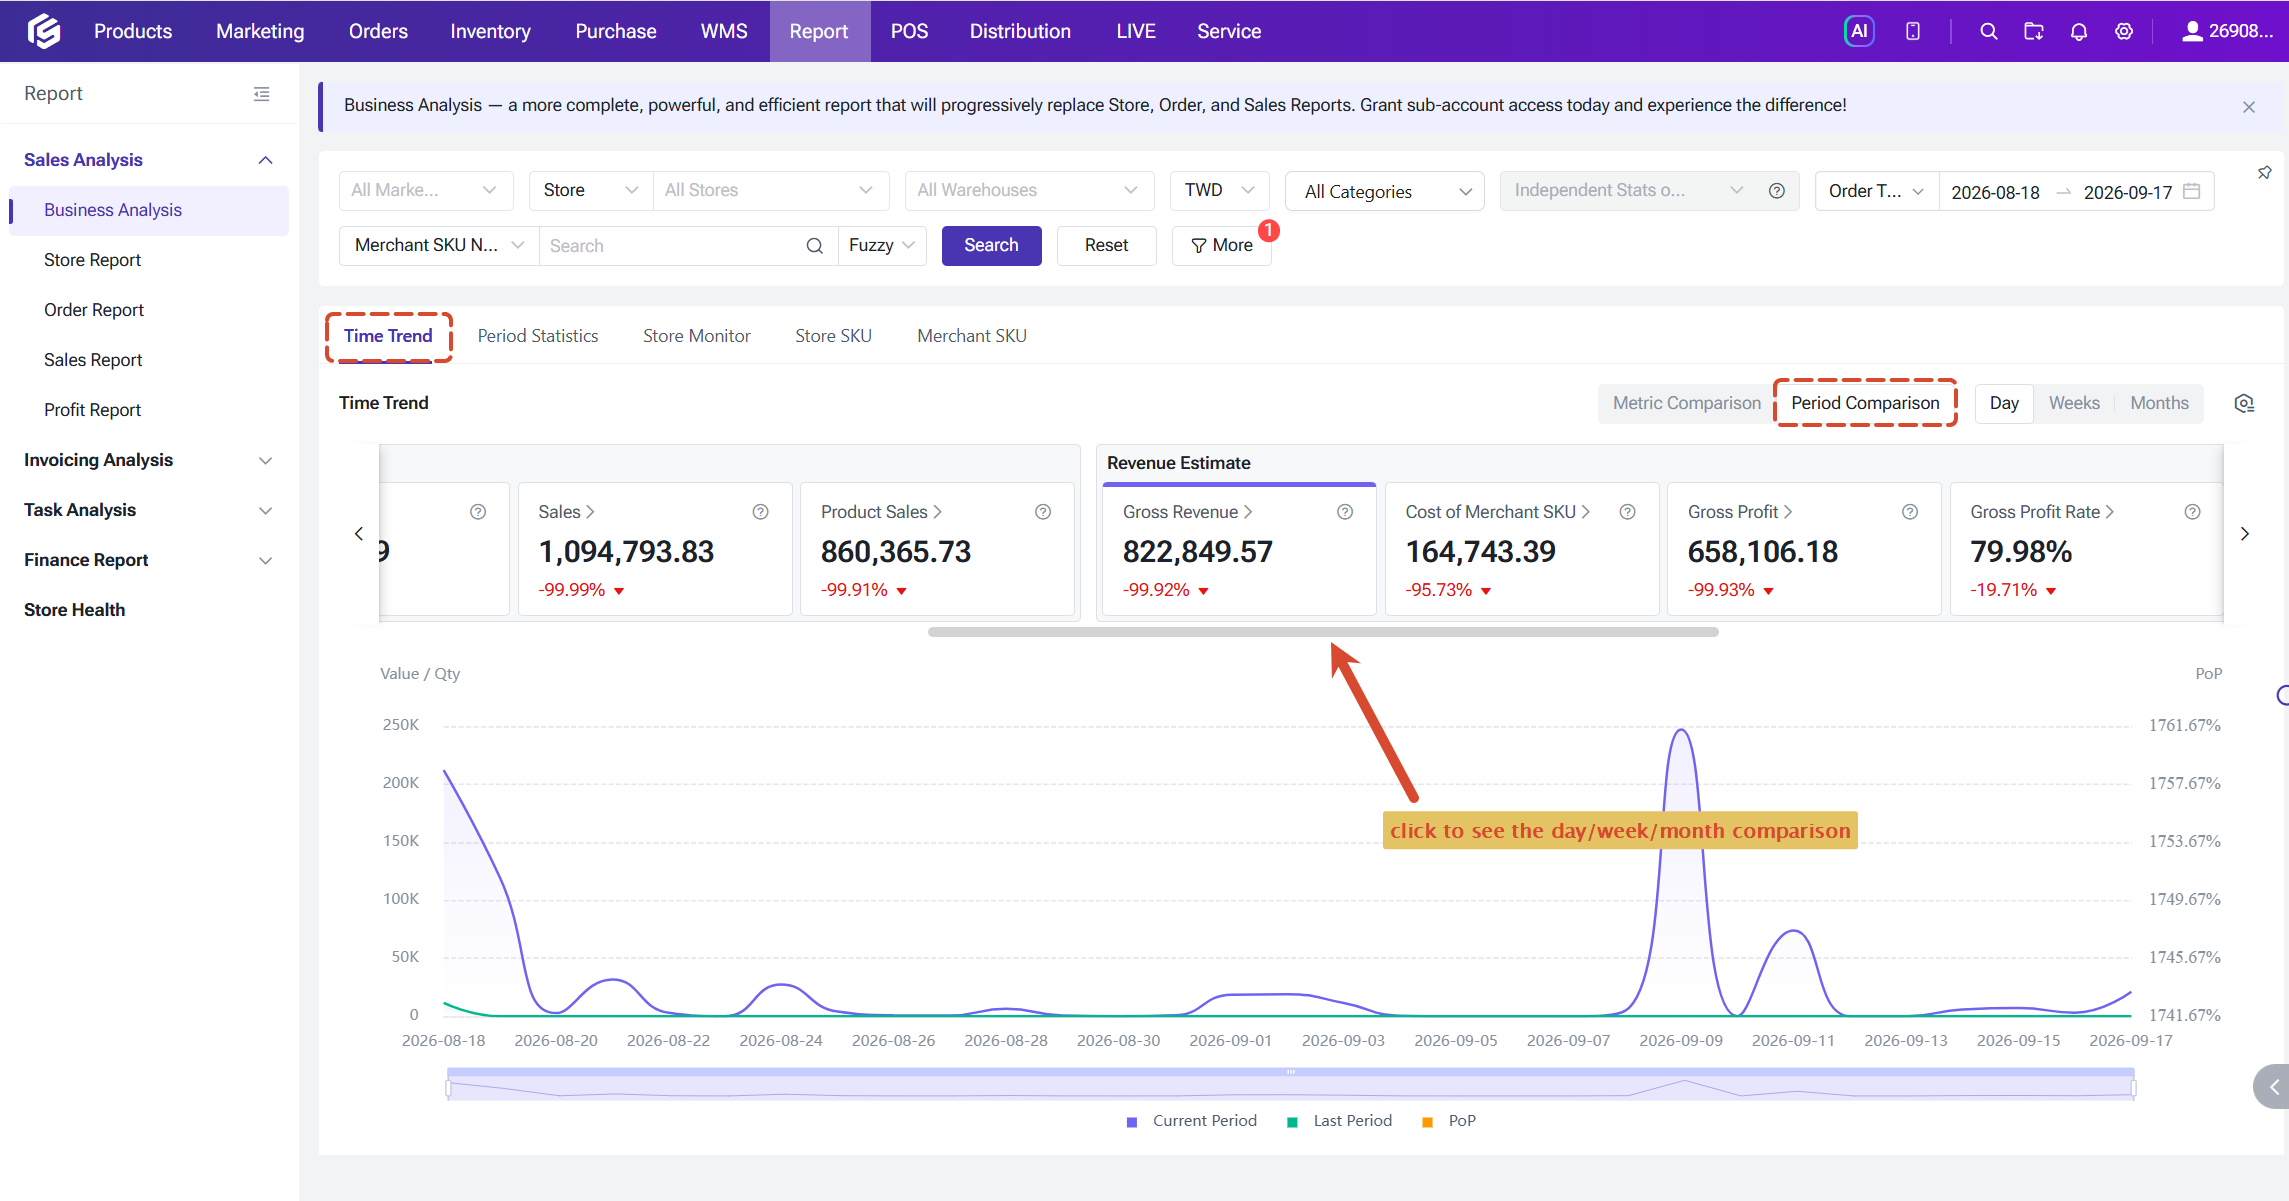
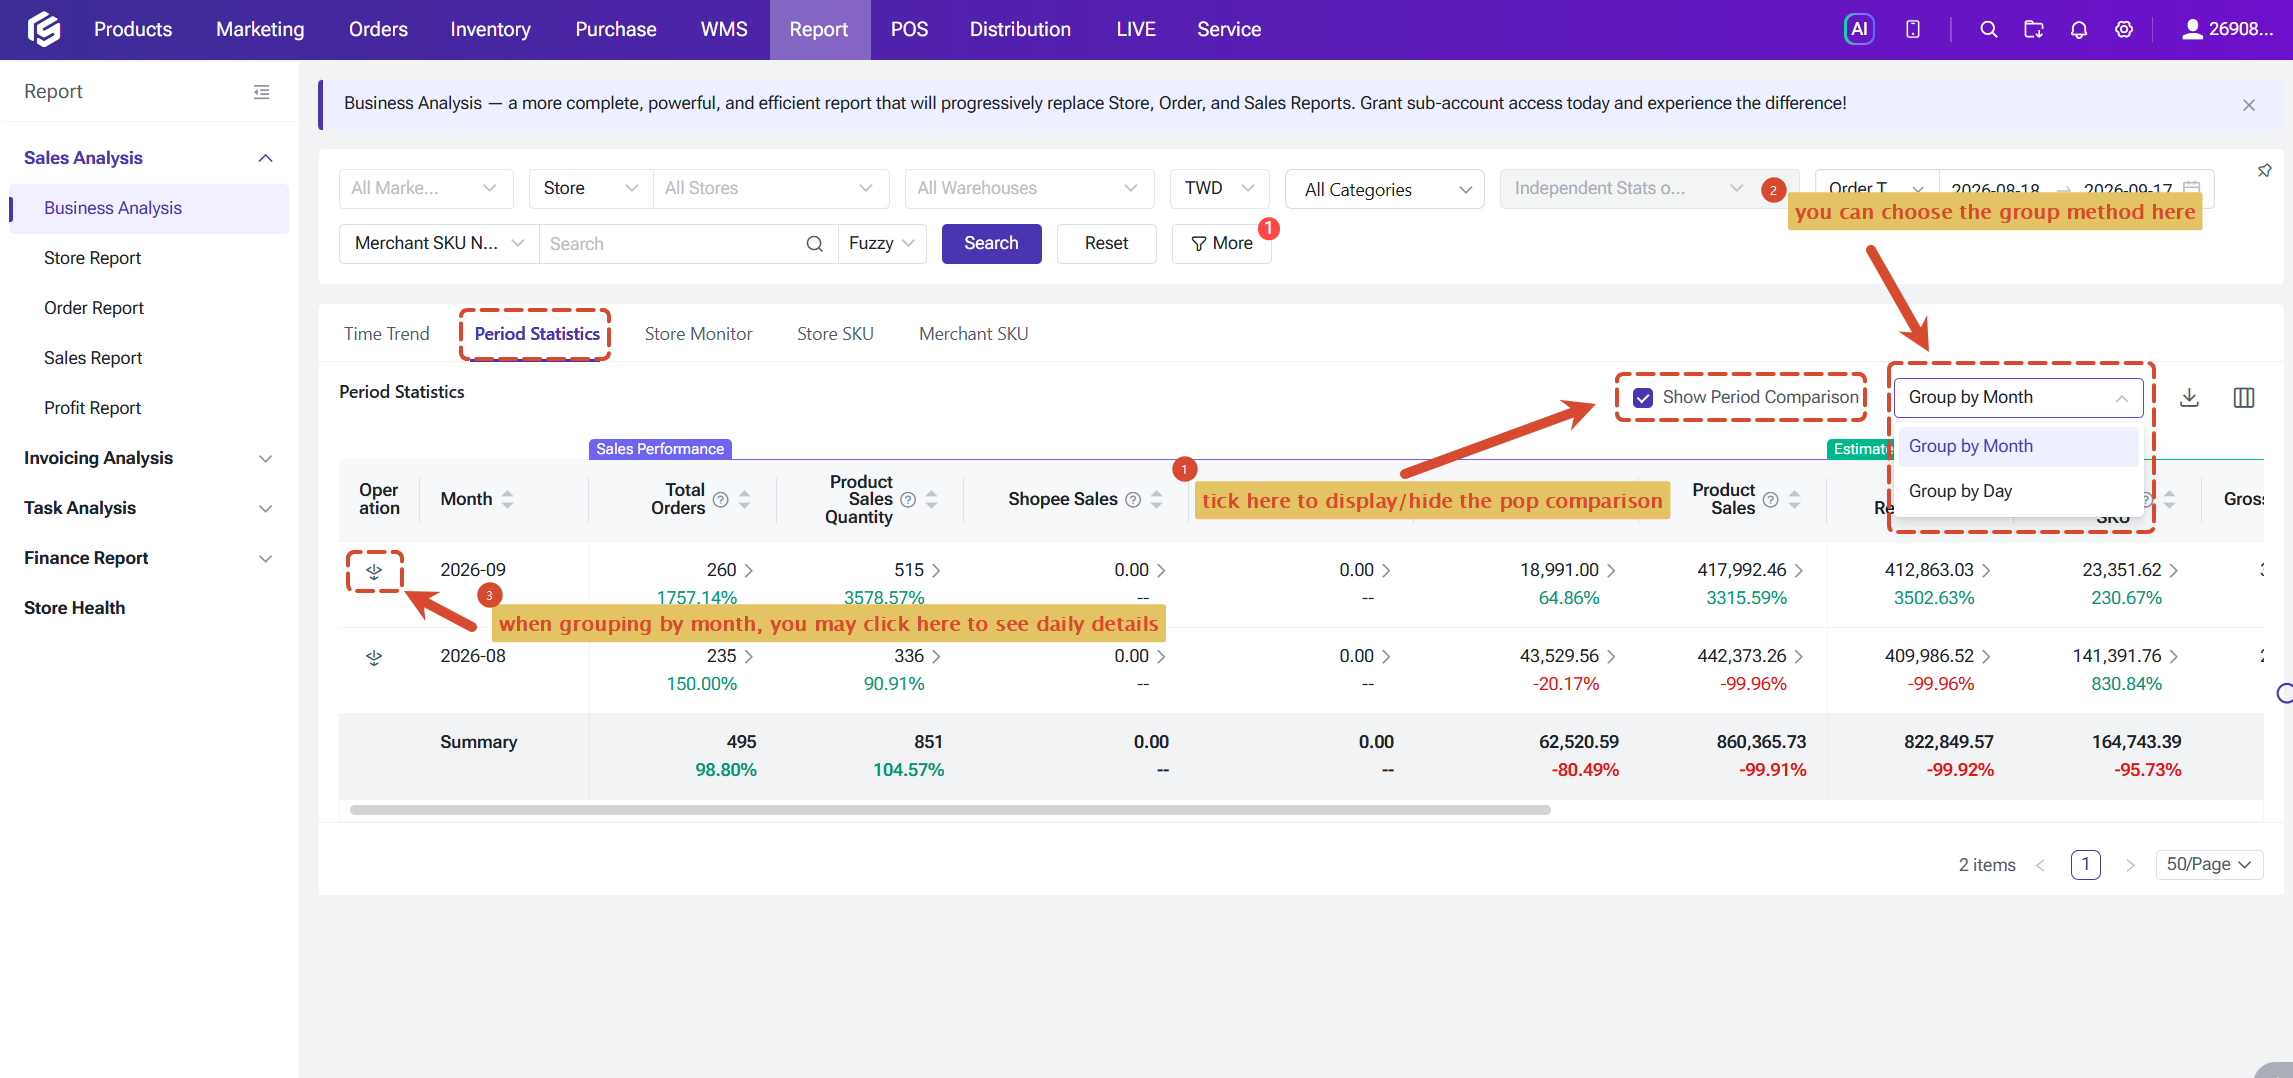
The Period Statistics module aggregates order-related data either by day, week or month. When viewing monthly aggregations, you can drill down to see the underlying daily breakdown. A period-over-period comparison toggle is available and can be enabled as needed (disabled by default). Data can be exported in both daily and monthly formats.
If period-over-period comparison is enabled, hovering over any data cell for more than 1 second will display a tooltip showing the current period range, comparison period range, current period value, comparison period value, and the period-over-period change rate.
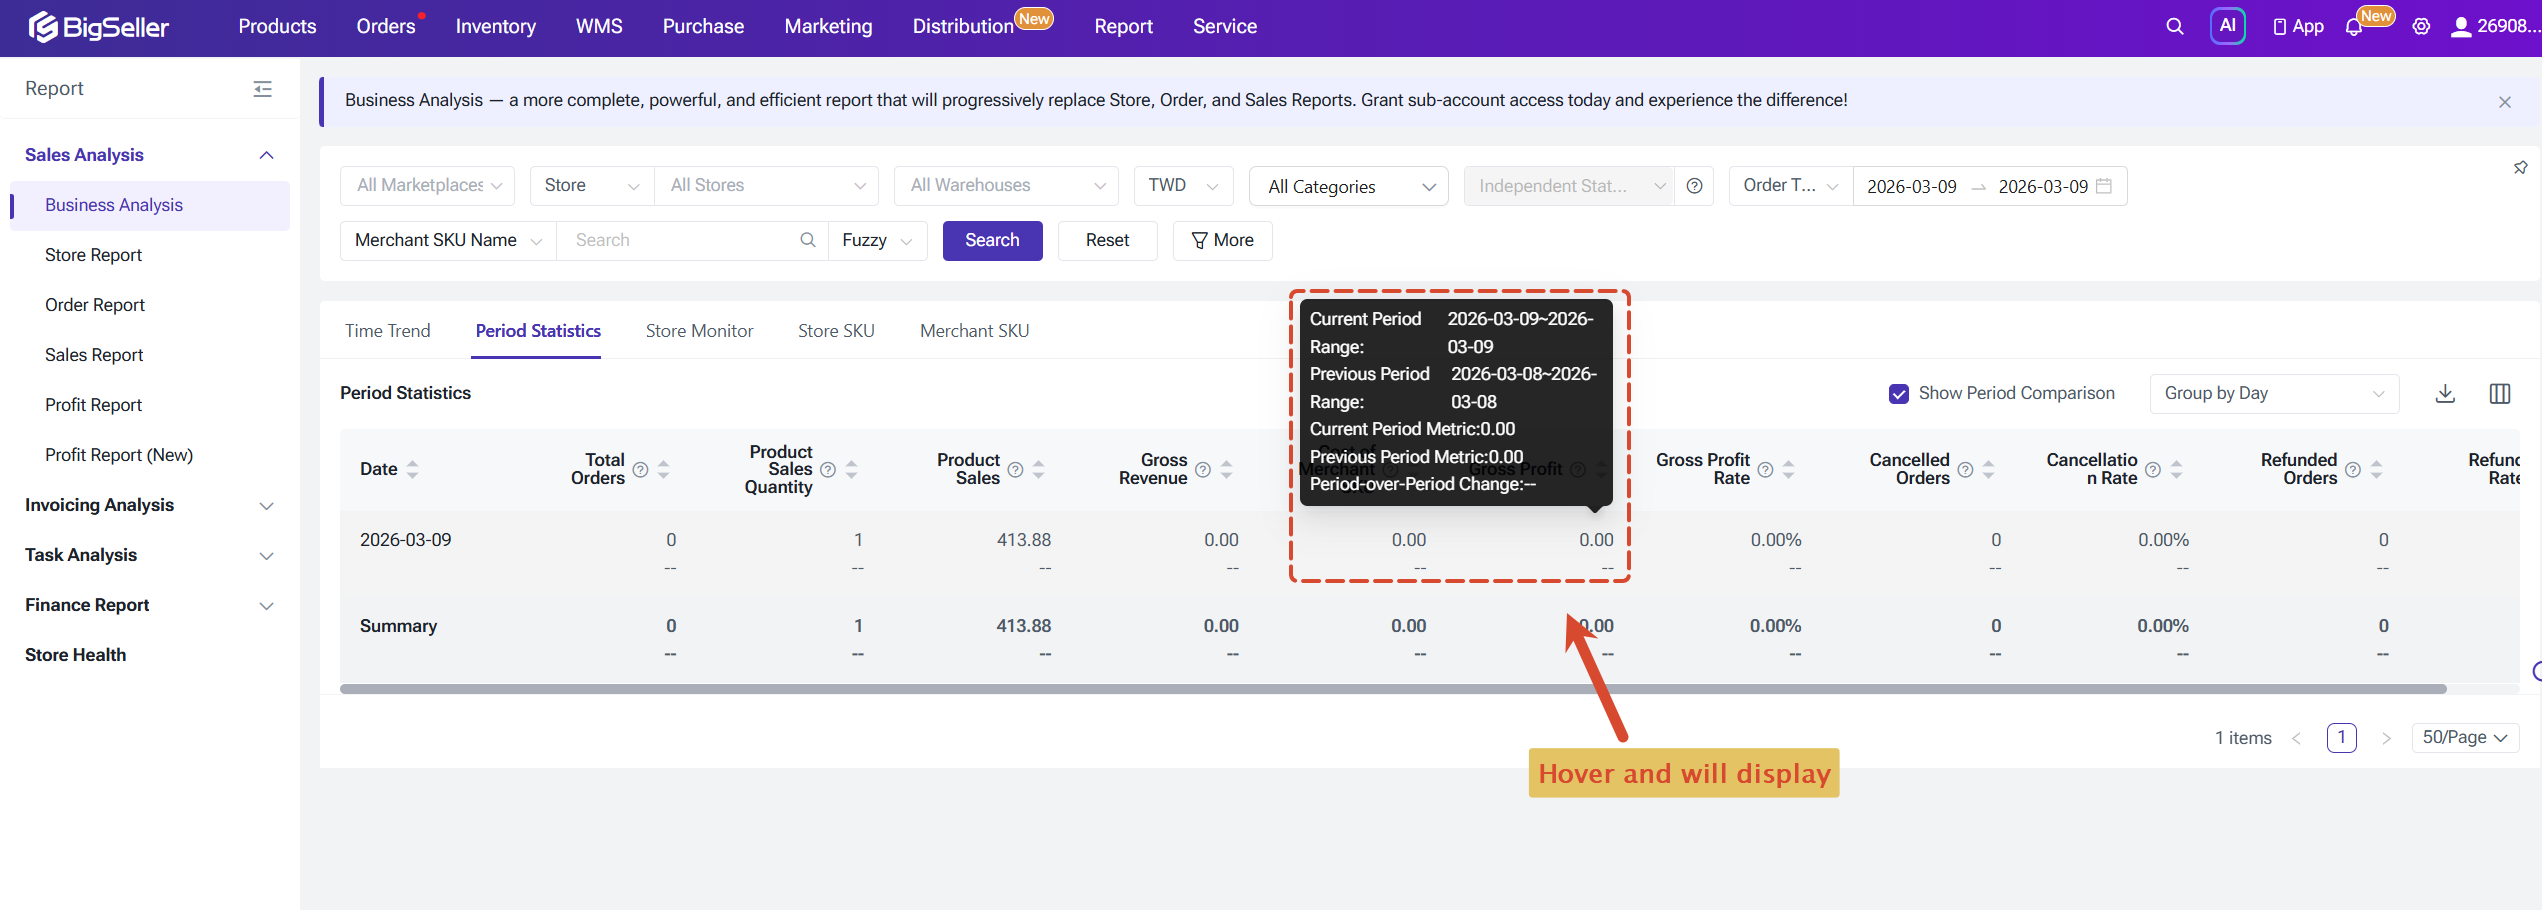
If period-over-period comparison is enabled, hovering over any data cell for more than 1 second will display a tooltip showing the current period range, comparison period range, current period value, comparison period value, and the period-over-period change rate.
3. Store Monitor
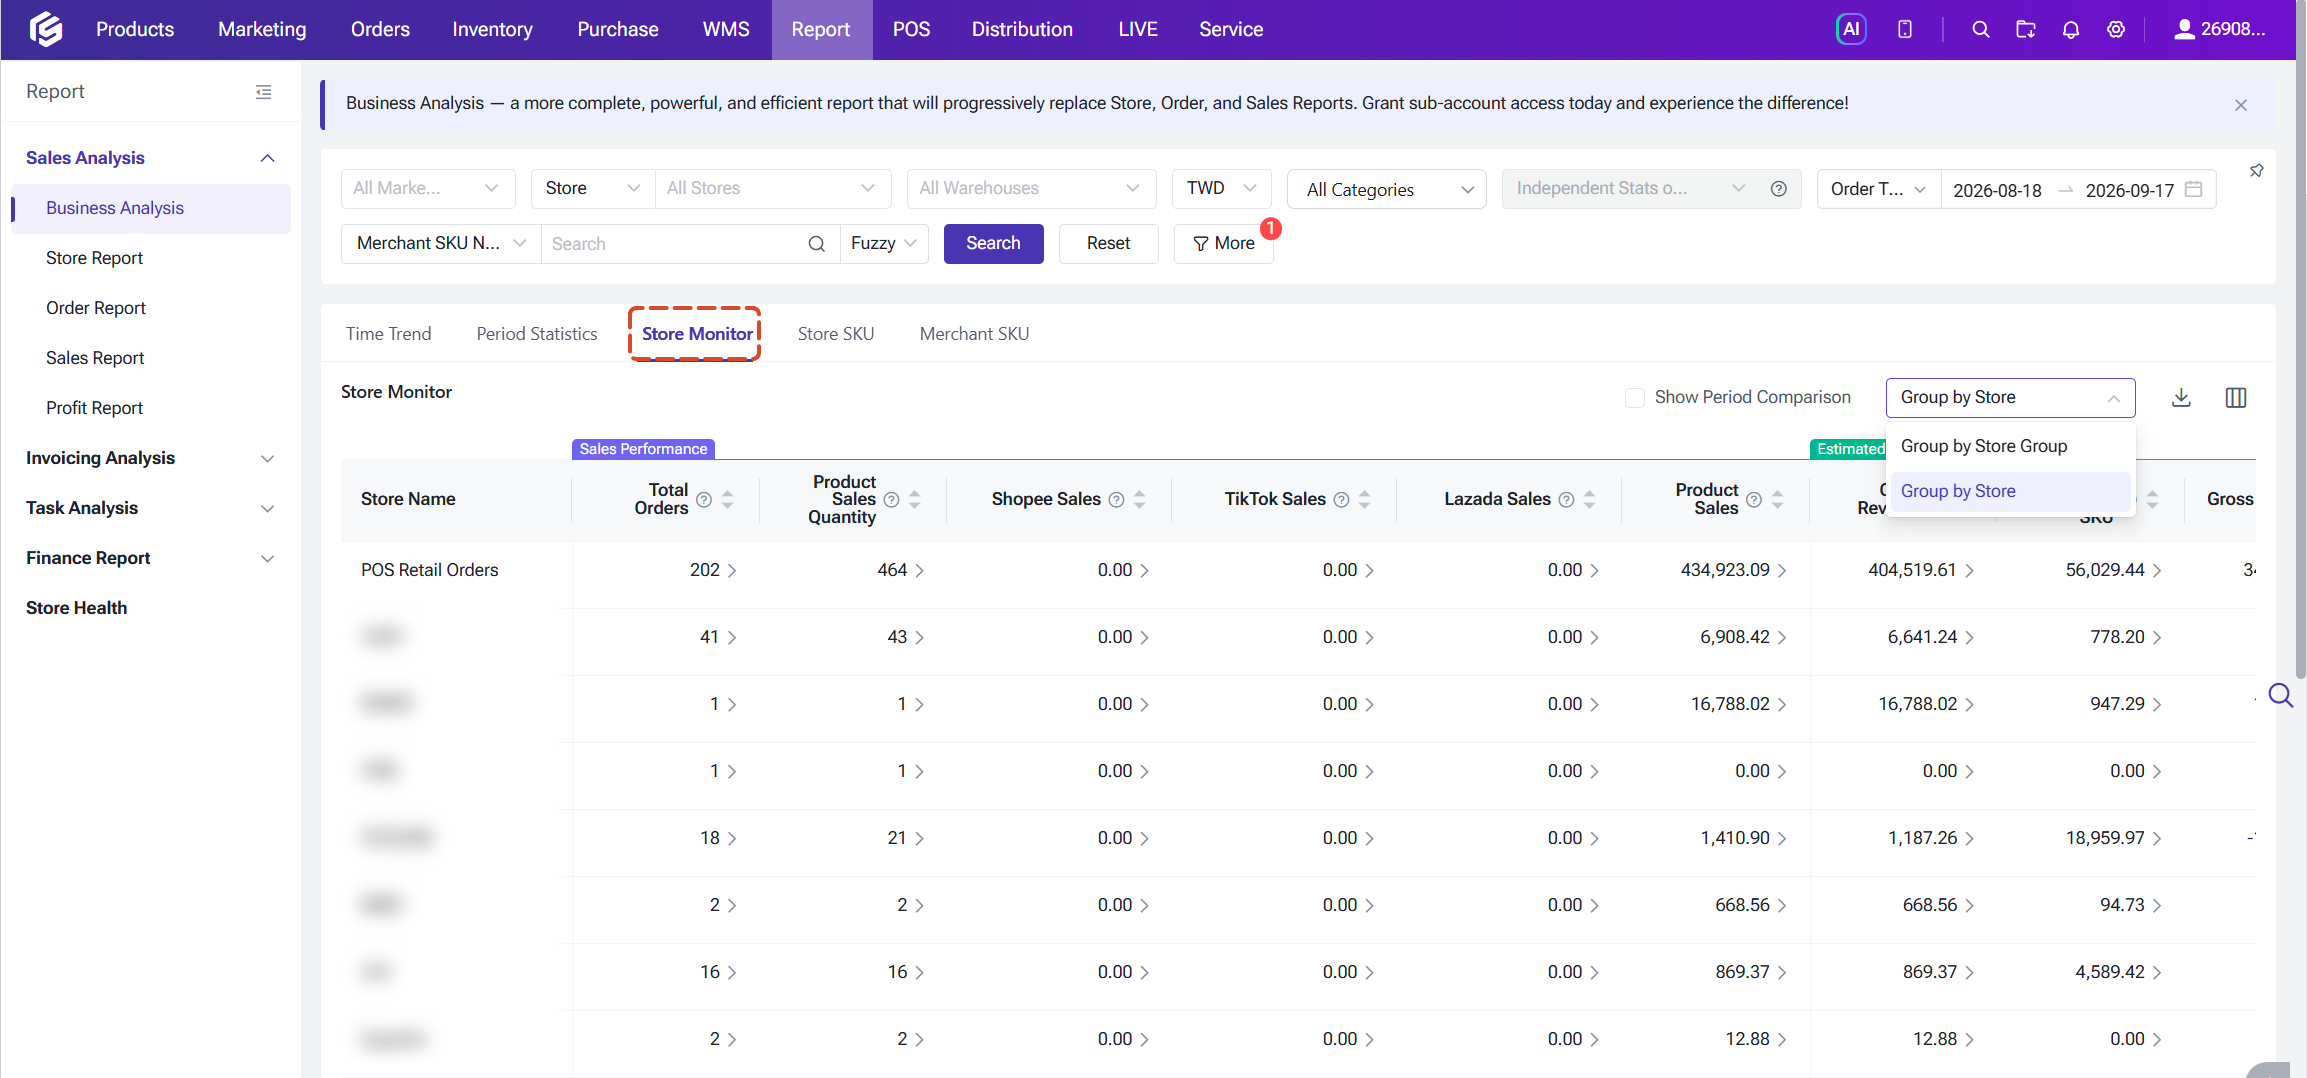
The Store Monitor module aggregates order-related data by store or by store group. When viewing by store group, you can drill down to see performance at the individual store level. Its overall capabilities are largely consistent with Period Statistics, but with a stronger emphasis on store-level comparison and monitoring.
4. Store SKU
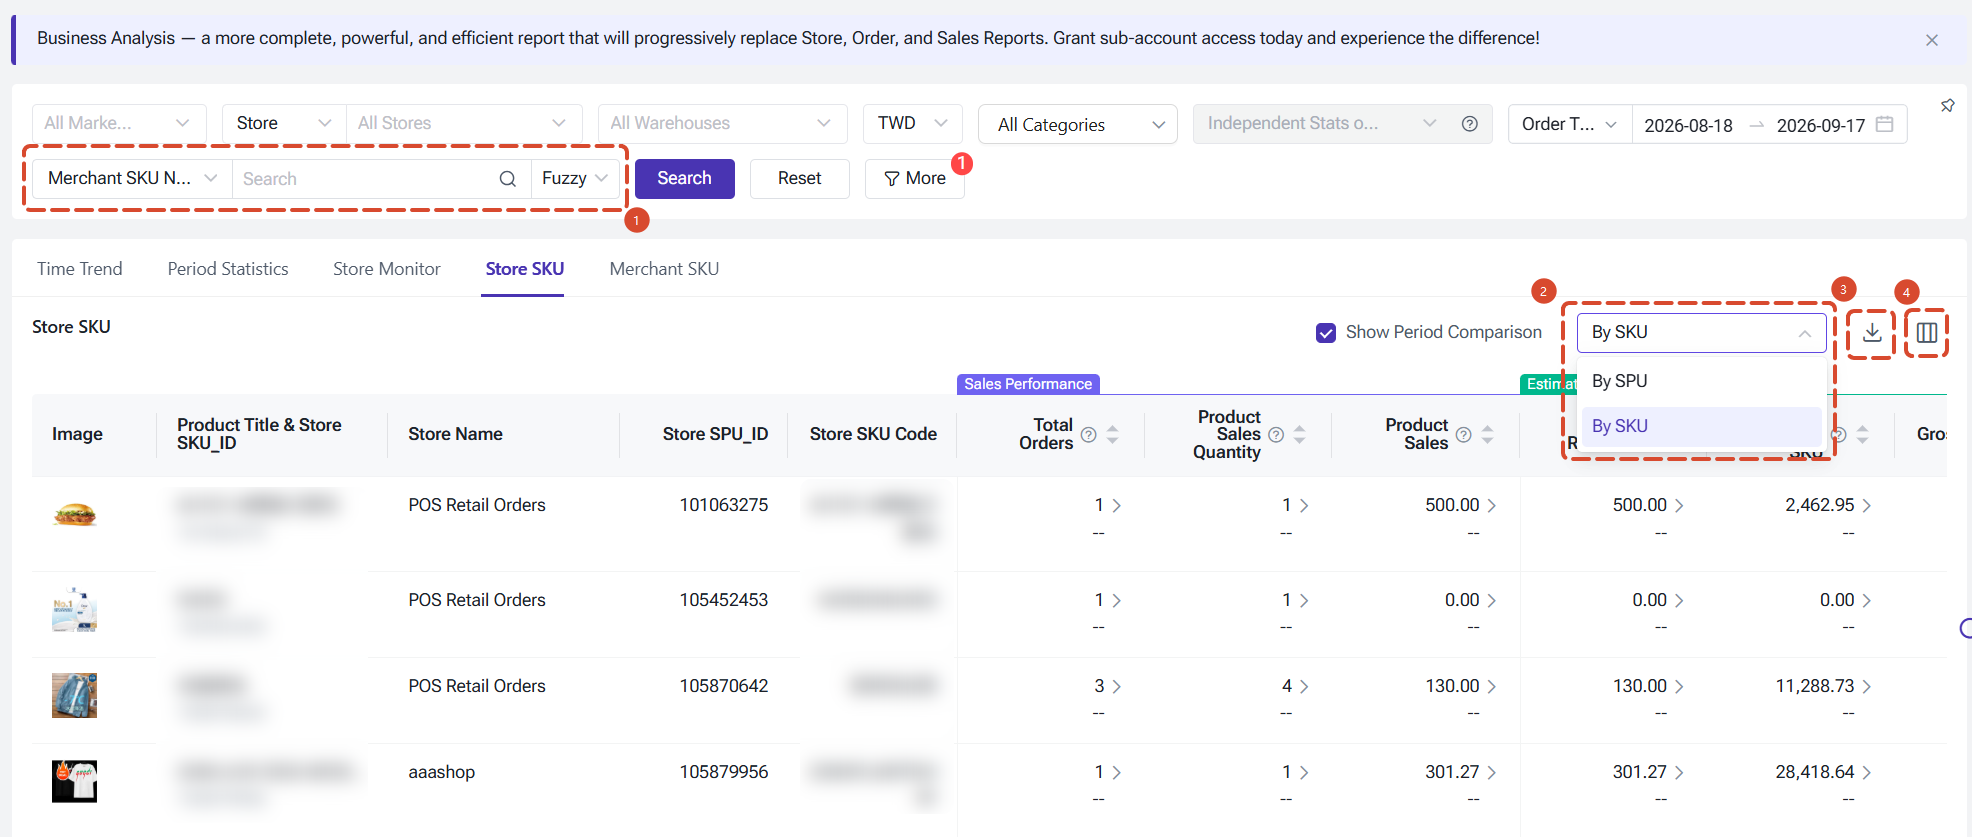
The Store SKU module provides store SKU-level performance data aggregated at the store level, allowing you to analyze how individual store SKUs are performing across sales, refunds, and profitability dimensions.Key features of this module:
- Keyword search — You can search for products by keyword. Please note that not all metrics support SKU-level statistics under keyword search. Metrics containing a sales amount component (such as Sales, Valid Sales, Sales Per Order, and Cancelled Order Amount) and metrics that cannot be counted at SKU or SPU granularity (such as Product Sell-through Rate, Available Store SKU Count, and SKU Count) will display "--" when keyword search is active.
- SPU / SKU toggle — Data can be aggregated either by SPU or by SKU. Use the toggle in the table header to switch between views.
- Export — You can quick export data in this page for self analysis.
- Metric customization — You can customize which columns are displayed and their order, consistent with other modules.
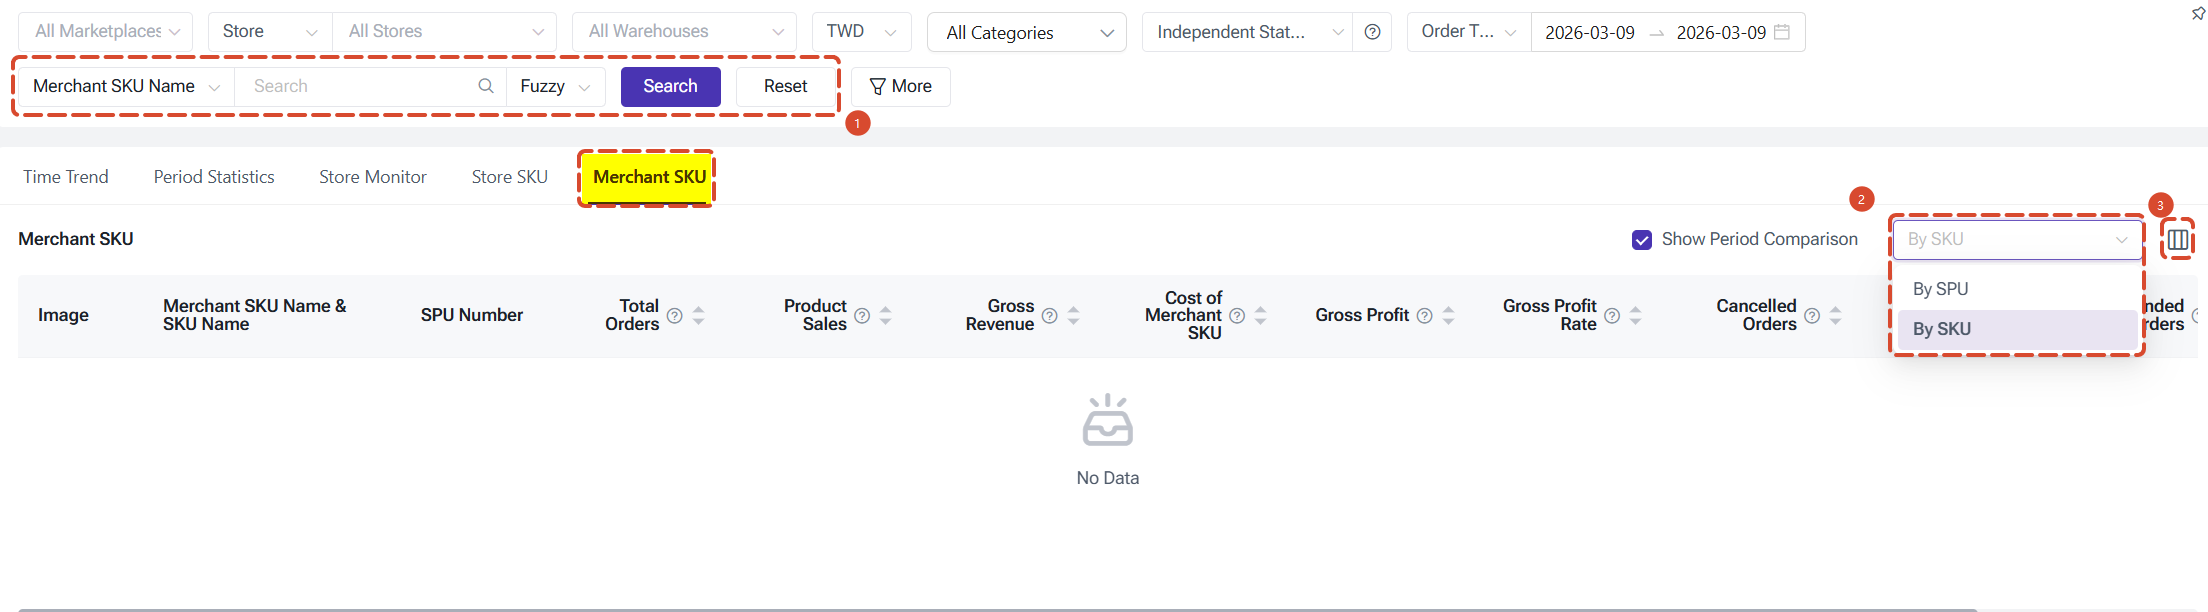
5. Merchant SKU
The Merchant SKU module provides SKU-level performance data aggregated at the Merchant SKU level, enabling cross-store analysis of how individual Merchant SKUs are performing across your entire operation.
Key features of this module:
- Keyword search — You can search for products by keyword. The same keyword search restrictions apply as in store SKU: metrics with a sales amount component and metrics that cannot be counted at SKU or SPU granularity will display "--" when keyword search is active. Order volume metrics support exact match only.
- SPU / SKU toggle — Data can be aggregated either by SPU or by SKU. Use the toggle in the table header to switch between views.
- Export — You can quick export data in this page for self analysis.
- Metric customization — You can customize which columns are displayed and their order, consistent with other modules.
Is this content helpful?
Thank you for your feedback. It drives us to provide better service.
Please contact us if the document can't answer your questions